Hacking Web Apps - Part 1
Introduction to Attacking Common Applications
Web applications are interactive applications that can be accessed via web browsers. Web applications typically adopt a client-server architecture to run and handle interactions. They usually are made up of front-end components (the website interface, or “what the user sees”) that run on the client-side (browser) and other back-end components (web application source code) that run on the server-side (back end server/databases).
Application Discovery & Enumeration
As penetration testers, we need to have strong enumeration skills and be able to get the “lay of the land” on any network starting with very little to no information (black box discovery or just a set of CIDR ranges). Typically, when we connect to a network, we’ll start with a ping sweep to identify “live hosts.” From there, we will usually begin targeted port scanning and, eventually, deeper port scanning to identify running services. In a network with hundreds or thousands of hosts, this enumeration data can become unwieldy. Let’s say we perform an Nmap port scan to identify common web services such as:
Nmap - Web Discovery
h4ckr00t@htb[/htb]$ nmap -p 80,443,8000,8080,8180,8888,10000 --open -oA web_discovery -iL scope_list
We may find an enormous amount of hosts with services running on ports 80 and 443 alone. What do we do with this data? Sifting through the enumeration data by hand in a large environment would be far too time-consuming, especially since most assessments are under strict time constraints. Browsing to each IP/hostname + port would also be highly inefficient.
Luckily for us, several great tools exist that can greatly assist in this process. Two phenomenal tools that every tester should have in their arsenal are EyeWitness and Aquatone. Both of these tools can be fed raw Nmap XML scan output (Aquatone can also take Masscan XML; EyeWitness can take Nessus XML output) and be used to quickly inspect all hosts running web applications and take screenshots of each. The screenshots are then assembled into a report that we can work through in the web browser to assess the web attack surface.
Getting Organized
It is important to time and date stamp every scan that we perform and save all output and the exact scan syntax that was performed and the targeted hosts. This can be useful later on if the client has any questions about the activity they saw during the assessment. Being organized from the start and keeping detailed logs and notes will help us greatly with the final report.
Initial Enumeration
Let’s assume our client provided us with the following scope:
h4ckr00t@htb[/htb]$ cat scope_list

app.inlanefreight.local
dev.inlanefreight.local
drupal-dev.inlanefreight.local
drupal-qa.inlanefreight.local
drupal-acc.inlanefreight.local
drupal.inlanefreight.local
blog-dev.inlanefreight.local
blog.inlanefreight.local
app-dev.inlanefreight.local
jenkins-dev.inlanefreight.local
jenkins.inlanefreight.local
web01.inlanefreight.local
gitlab-dev.inlanefreight.local
gitlab.inlanefreight.local
support-dev.inlanefreight.local
support.inlanefreight.local
inlanefreight.local
10.129.201.50
Let’s dig into the scope list mentioned above with an Nmap scan that will typically discover most web applications in an environment. We will, of course, perform deeper scans later on, but this will give us a good starting point.
Not all hosts in the scope list above will be accessible when spawning the target below. There will be separate, similar, exercises at the end of this section in order to reproduce much of what is shown here.
h4ckr00t@htb[/htb]$ sudo  nmap -p 80,443,8000,8080,8180,8888,10000 --open -oA web_discovery -iL scope_list

Starting Nmap 7.80 ( https://nmap.org ) at 2021-09-07 21:49 EDT
Stats: 0:00:07 elapsed; 1 hosts completed (4 up), 4 undergoing SYN Stealth Scan
SYN Stealth Scan Timing: About 81.24% done; ETC: 21:49 (0:00:01 remaining)

Nmap scan report for app.inlanefreight.local (10.129.42.195)
Host is up (0.12s latency).
Not shown: 998 closed ports
PORT   STATE SERVICE
22/tcp open  ssh
80/tcp open  http

Nmap scan report for app-dev.inlanefreight.local (10.129.201.58)
Host is up (0.12s latency).
Not shown: 993 closed ports
PORT     STATE SERVICE
22/tcp   open  ssh
80/tcp   open  http
8000/tcp open  http-alt
8009/tcp open  ajp13
8080/tcp open  http-proxy
8180/tcp open  unknown
8888/tcp open  sun-answerbook

Nmap scan report for gitlab-dev.inlanefreight.local (10.129.201.88)
Host is up (0.12s latency).
Not shown: 997 closed ports
PORT     STATE SERVICE
22/tcp   open  ssh
80/tcp   open  http
8081/tcp open  blackice-icecap

Nmap scan report for 10.129.201.50
Host is up (0.13s latency).
Not shown: 991 closed ports
PORT     STATE SERVICE
80/tcp   open  http
135/tcp  open  msrpc
139/tcp  open  netbios-ssn
445/tcp  open  microsoft-ds
3389/tcp open  ms-wbt-server
5357/tcp open  wsdapi
8000/tcp open  http-alt
8080/tcp open  http-proxy
8089/tcp open  unknown
Nmap done: 16 IP addresses (4 hosts up) scanned in 12.45 seconds
Enumerating one of the hosts further using an Nmap service scan (-sV) against the default top 1,000 ports can tell us more about what is running on the webserver.
h4ckr00t@htb[/htb]$ sudo nmap --open -sV 10.129.201.50

Starting Nmap 7.80 ( https://nmap.org ) at 2021-09-07 21:58 EDT
Nmap scan report for 10.129.201.50
Host is up (0.13s latency).
Not shown: 991 closed ports
PORT     STATE SERVICE       VERSION
80/tcp   open  http          Microsoft IIS httpd 10.0
135/tcp  open  msrpc         Microsoft Windows RPC
139/tcp  open  netbios-ssn   Microsoft Windows netbios-ssn
445/tcp  open  microsoft-ds?
3389/tcp open  ms-wbt-server Microsoft Terminal Services
5357/tcp open  http          Microsoft HTTPAPI httpd 2.0 (SSDP/UPnP)
8000/tcp open  http          Splunkd httpd
8080/tcp open  http          Indy httpd 17.3.33.2830 (Paessler PRTG bandwidth monitor)
8089/tcp open  ssl/http      Splunkd httpd (free license; remote login disabled)
Service Info: OS: Windows; CPE: cpe:/o:microsoft:windows

Service detection performed. Please report any incorrect results at https://nmap.org/submit/ .
Nmap done: 1 IP address (1 host up) scanned in 38.63 seconds
From the output above, we can see that an IIS web server is running on the default port 80, and it appears that Splunk is running on port 8000/8089, while PRTG Network Monitor is present on port 8080. If we were in a medium to large-sized environment, this type of enumeration would be inefficient. It could result in us missing a web application that may prove critical to the engagement’s success.
Using EyeWitness
EyeWitness can take the XML output from both Nmap and Nessus and create a report with screenshots of each web application present on the various ports using Selenium. It will also take things a step further and categorize the applications where possible, fingerprint them, and suggest default credentials based on the application. It can also be given a list of IP addresses and URLs and be told to pre-pend http:// and https:// to the front of each. It will perform DNS resolution for IPs and can be given a specific set of ports to attempt to connect to and screenshot.
We can install EyeWitness via apt:
h4ckr00t@htb[/htb]$ sudo apt install eyewitness
or clone the repository, navigate to the Python/setup directory and run the setup.sh installer script. EyeWitness can also be run from a Docker container, and a Windows version is available, which can be compiled using Visual Studio.
Running eyewitness -h will show us the options available to us:
h4ckr00t@htb[/htb]$ eyewitness -h

usage: EyeWitness.py [--web] [-f Filename] [-x Filename.xml]
                     [--single Single URL] [--no-dns] [--timeout Timeout]
                     [--jitter # of Seconds] [--delay # of Seconds]
                     [--threads # of Threads]
                     [--max-retries Max retries on a timeout]
                     [-d Directory Name] [--results Hosts Per Page]
                     [--no-prompt] [--user-agent User Agent]
                     [--difference Difference Threshold]
                     [--proxy-ip 127.0.0.1] [--proxy-port 8080]
                     [--proxy-type socks5] [--show-selenium] [--resolve]
                     [--add-http-ports ADD_HTTP_PORTS]
                     [--add-https-ports ADD_HTTPS_PORTS]
                     [--only-ports ONLY_PORTS] [--prepend-https]
                     [--selenium-log-path SELENIUM_LOG_PATH] [--resume ew.db]
                     [--ocr]

EyeWitness is a tool used to capture screenshots from a list of URLs

Protocols:
  --web                 HTTP Screenshot using Selenium

Input Options:
  -f Filename           Line-separated file containing URLs to capture
  -x Filename.xml       Nmap XML or .Nessus file
  --single Single URL   Single URL/Host to capture
  --no-dns              Skip DNS resolution when connecting to websites

Timing Options:
  --timeout Timeout     Maximum number of seconds to wait while requesting a
                        web page (Default: 7)
  --jitter # of Seconds
                        Randomize URLs and add a random delay between requests
  --delay # of Seconds  Delay between the opening of the navigator and taking
                        the screenshot
  --threads # of Threads
                        Number of threads to use while using file based input
  --max-retries Max retries on a timeout
                        Max retries on timeouts
Let’s run the default --web option to take screenshots using the Nmap XML output from the discovery scan as input.
h4ckr00t@htb[/htb]$ eyewitness --web -x web_discovery.xml -d inlanefreight_eyewitness

################################################################################
#                                  EyeWitness                                  #
################################################################################
#           FortyNorth Security - https://www.fortynorthsecurity.com           #
################################################################################

Starting Web Requests (26 Hosts)
Attempting to screenshot http://app.inlanefreight.local
Attempting to screenshot http://app-dev.inlanefreight.local
Attempting to screenshot http://app-dev.inlanefreight.local:8000
Attempting to screenshot http://app-dev.inlanefreight.local:8080
Attempting to screenshot http://gitlab-dev.inlanefreight.local
Attempting to screenshot http://10.129.201.50
Attempting to screenshot http://10.129.201.50:8000
Attempting to screenshot http://10.129.201.50:8080
Attempting to screenshot http://dev.inlanefreight.local
Attempting to screenshot http://jenkins-dev.inlanefreight.local
Attempting to screenshot http://jenkins-dev.inlanefreight.local:8000
Attempting to screenshot http://jenkins-dev.inlanefreight.local:8080
Attempting to screenshot http://support-dev.inlanefreight.local
Attempting to screenshot http://drupal-dev.inlanefreight.local
[*] Hit timeout limit when connecting to http://10.129.201.50:8000, retrying
Attempting to screenshot http://jenkins.inlanefreight.local
Attempting to screenshot http://jenkins.inlanefreight.local:8000
Attempting to screenshot http://jenkins.inlanefreight.local:8080
Attempting to screenshot http://support.inlanefreight.local
[*] Completed 15 out of 26 services
Attempting to screenshot http://drupal-qa.inlanefreight.local
Attempting to screenshot http://web01.inlanefreight.local
Attempting to screenshot http://web01.inlanefreight.local:8000
Attempting to screenshot http://web01.inlanefreight.local:8080
Attempting to screenshot http://inlanefreight.local
Attempting to screenshot http://drupal-acc.inlanefreight.local
Attempting to screenshot http://drupal.inlanefreight.local
Attempting to screenshot http://blog-dev.inlanefreight.local
Finished in 57.859838008880615 seconds

[*] Done! Report written in the /home/mrb3n/Projects/inlanfreight/inlanefreight_eyewitness folder!
Would you like to open the report now? [Y/n]
Using Aquatone
Aquatone, as mentioned before, is similar to EyeWitness and can take screenshots when provided a .txt file of hosts or an Nmap .xml file with the -nmap flag. We can compile Aquatone on our own or download a precompiled binary. After downloading the binary, we just need to extract it, and we are ready to go.
Note:
Aquatoneis currently under active development in a new fork, focusing on improvements and feature enhancements. Refer to the installation guide provided in the repository.
h4ckr00t@htb[/htb]$ wget https://github.com/michenriksen/aquatone/releases/download/v1.7.0/aquatone_linux_amd64_1.7.0.zip
h4ckr00t@htb[/htb]$ unzip aquatone_linux_amd64_1.7.0.zip

Archive:  aquatone_linux_amd64_1.7.0.zip
  inflating: aquatone
  inflating: README.md
  inflating: LICENSE.txt
We can move it to a location in our $PATH such as /usr/local/bin to be able to call the tool from anywhere or just drop the binary in our working (say, scans) directory. It’s personal preference but typically most efficient to build our attack VMs with most tools available to use without having to constantly change directories or call them from other directories.
h4ckr00t@htb[/htb]$ echo $PATH

/home/mrb3n/.local/bin:/snap/bin:/usr/sandbox/:/usr/local/bin:/usr/bin:/bin:/usr/local/games:/usr/games:/usr/share/games:/usr/local/sbin:/usr/sbin:/sbin:/usr/local/bin:/usr/bin:/bin:/usr/local/games:/usr/games
In this example, we provide the tool the same web_discovery.xml Nmap output specifying the -nmap flag, and we’re off to the races.
h4ckr00t@htb[/htb]$ cat web_discovery.xml | ./aquatone -nmap

aquatone v1.7.0 started at 2021-09-07T22:31:03-04:00

Targets    : 65
Threads    : 6
Ports      : 80, 443, 8000, 8080, 8443
Output dir : .

http://web01.inlanefreight.local:8000/: 403 Forbidden
http://app.inlanefreight.local/: 200 OK
http://jenkins.inlanefreight.local/: 403 Forbidden
http://app-dev.inlanefreight.local/: 200
http://app-dev.inlanefreight.local/: 200
http://app-dev.inlanefreight.local:8000/: 403 Forbidden
http://jenkins.inlanefreight.local:8000/: 403 Forbidden
http://web01.inlanefreight.local:8080/: 200
http://app-dev.inlanefreight.local:8000/: 403 Forbidden
http://10.129.201.50:8000/: 200 OK

<SNIP>

http://web01.inlanefreight.local:8000/: screenshot successful
http://app.inlanefreight.local/: screenshot successful
http://app-dev.inlanefreight.local/: screenshot successful
http://jenkins.inlanefreight.local/: screenshot successful
http://app-dev.inlanefreight.local/: screenshot successful
http://app-dev.inlanefreight.local:8000/: screenshot successful
http://jenkins.inlanefreight.local:8000/: screenshot successful
http://app-dev.inlanefreight.local:8000/: screenshot successful
http://app-dev.inlanefreight.local:8080/: screenshot successful
http://app.inlanefreight.local/: screenshot successful

<SNIP>

Calculating page structures... done
Clustering similar pages... done
Generating HTML report... done

Writing session file...Time:
 - Started at  : 2021-09-07T22:31:03-04:00
 - Finished at : 2021-09-07T22:31:36-04:00
 - Duration    : 33s

Requests:
 - Successful : 65
 - Failed     : 0

 - 2xx : 47
 - 3xx : 0
 - 4xx : 18
 - 5xx : 0

Screenshots:
 - Successful : 65
 - Failed     : 0

Wrote HTML report to: aquatone_report.html
Interpreting the Results
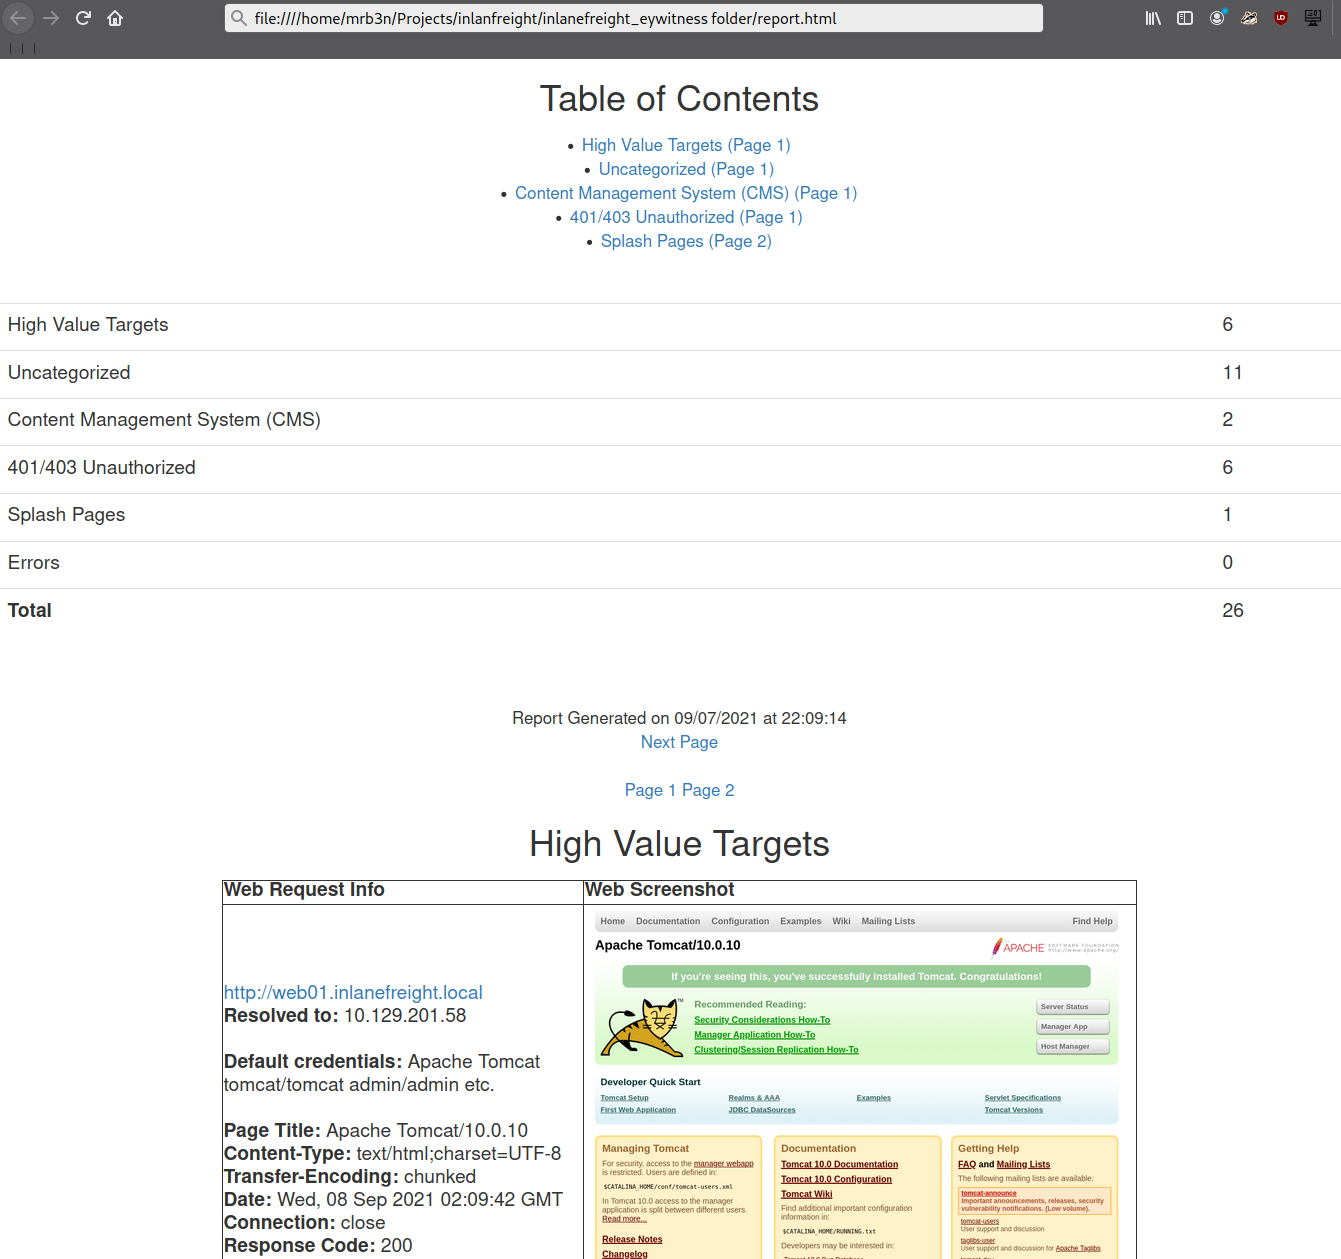
Even with the 26 hosts above, this report will save us time. Now imagine an environment with 500 or 5,000 hosts! After opening the report, we see that the report is organized into categories, with High Value Targets being first and typically the most “juicy” hosts to go after. I have run EyeWitness in very large environments and generated reports with hundreds of pages that take hours to go through. Often, the very large reports will have interesting hosts buried deep within them, so it is worth reviewing the entire thing and poking at/researching any applications we are unfamiliar with. I found the ManageEngine OpManager application mentioned in the introduction section buried deep into a very large report during an external penetration test. This instance was left configured with the default credentials admin:admin and left wide open to the internet. I was able to log in and achieve code execution by running a PowerShell script. The OpManager application was running in the context of a Domain Admin account which led to full compromise of the internal network.
In the below report, I would be immediately excited to see Tomcat on any assessment (but especially during an External Penetration Test) and would try default credentials on the /manager and /host-manager endpoints. If we can access either, we can upload a malicious WAR file and achieve remote code execution on the underlying host using JSP code. More on this later in the module.
Moving On
Now that we’ve worked through our application discovery methodology and set up our notetaking structure let’s deep dive into some of the most common applications that we will encounter time and time again. Please note that this module cannot possibly cover every single application that we will face. Rather, we aim to cover very prevalent ones and learn about common vulnerabilities, misconfigurations, and abusing their built-in functionality.

Video demonstration of Hacking Web Applications
The methodology and mindset of exploring these applications are even more important.
Comments powered by Talkyard.